A close-up view of a smartphone displaying a financial app with a graph and numerical data, held by a hand. The screen shows the brand 'Wealthsimple'. Above it is part of a laptop keyboard with keys visible. The background consists of a wooden surface.
Earnings Dashboard Overview

Track your earnings with real-time analytics and insights.

100$

A person is looking at a computer screen displaying a document titled 'Overview - All Private Equity - Fundraising, Investments, & D'. The document contains statistical charts and graphs related to private equity market statistics from 2007 to 2022. Various tabs and functions like 'File', 'Home', 'Insert', and 'Design' are visible in the interface.
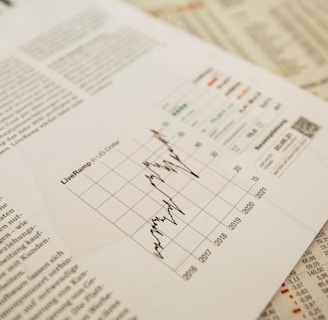
A financial report is laid out with an intricate chart showing data trends over multiple years. Surrounding text appears to be in a newspaper format, with graphs and tables prominently displayed. The focus is on a detailed line graph illustrating fluctuations.
Real-Time Earnings Insights

Get detailed analytics on your earnings history today.

200$

Earnings Overview

Explore your earnings potential with our comprehensive dashboard.

Earnings History Data

Review your past earnings and performance metrics easily.

150$

A computer screen displaying an analytics dashboard with metrics such as event activity, showing a current value of 4.7k for today's activity. There are graphs indicating trends and peaks in the data, as well as labels for different types of events.
A computer screen displays a detailed financial graph with multiple lines and grids, indicating market trends over time. The background is blurred, giving focus to the graph.
A person holding a smartphone displaying a financial app with a graph and balance information. The phone has a black case, and the interface shows details such as investment totals and changes. The background consists of a wooden table.
Rewards and Incentives

Discover various rewards programs and referral incentives available.

50$

Investor Leaderboard Insights

Compare your earnings with top investors in real-time.

300$

Risk and Security

Learn about our security measures and risk management strategies.

75$

Earnings Dashboard

Track your earnings, rewards, and analytics in real-time.

A person holds a smartphone displaying a financial or stock trading app, with detailed graphs and numerical data visible on the screen. In the background, there is a blurred computer monitor and office setting, suggesting a work environment.
Risk & Security

Explore comprehensive risk assessments and security audit reports for peace of mind.

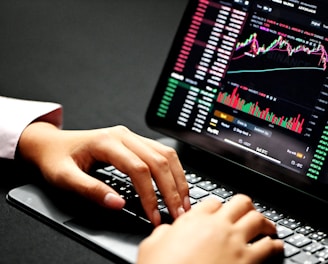
Hands typing on a laptop keyboard with a screen displaying financial graphs and stock market data. Multiple charts and numbers are visible, indicating online trading or financial analysis.
Incentives Program

Discover various bonus programs, referral rewards, and incentives to maximize your earnings.